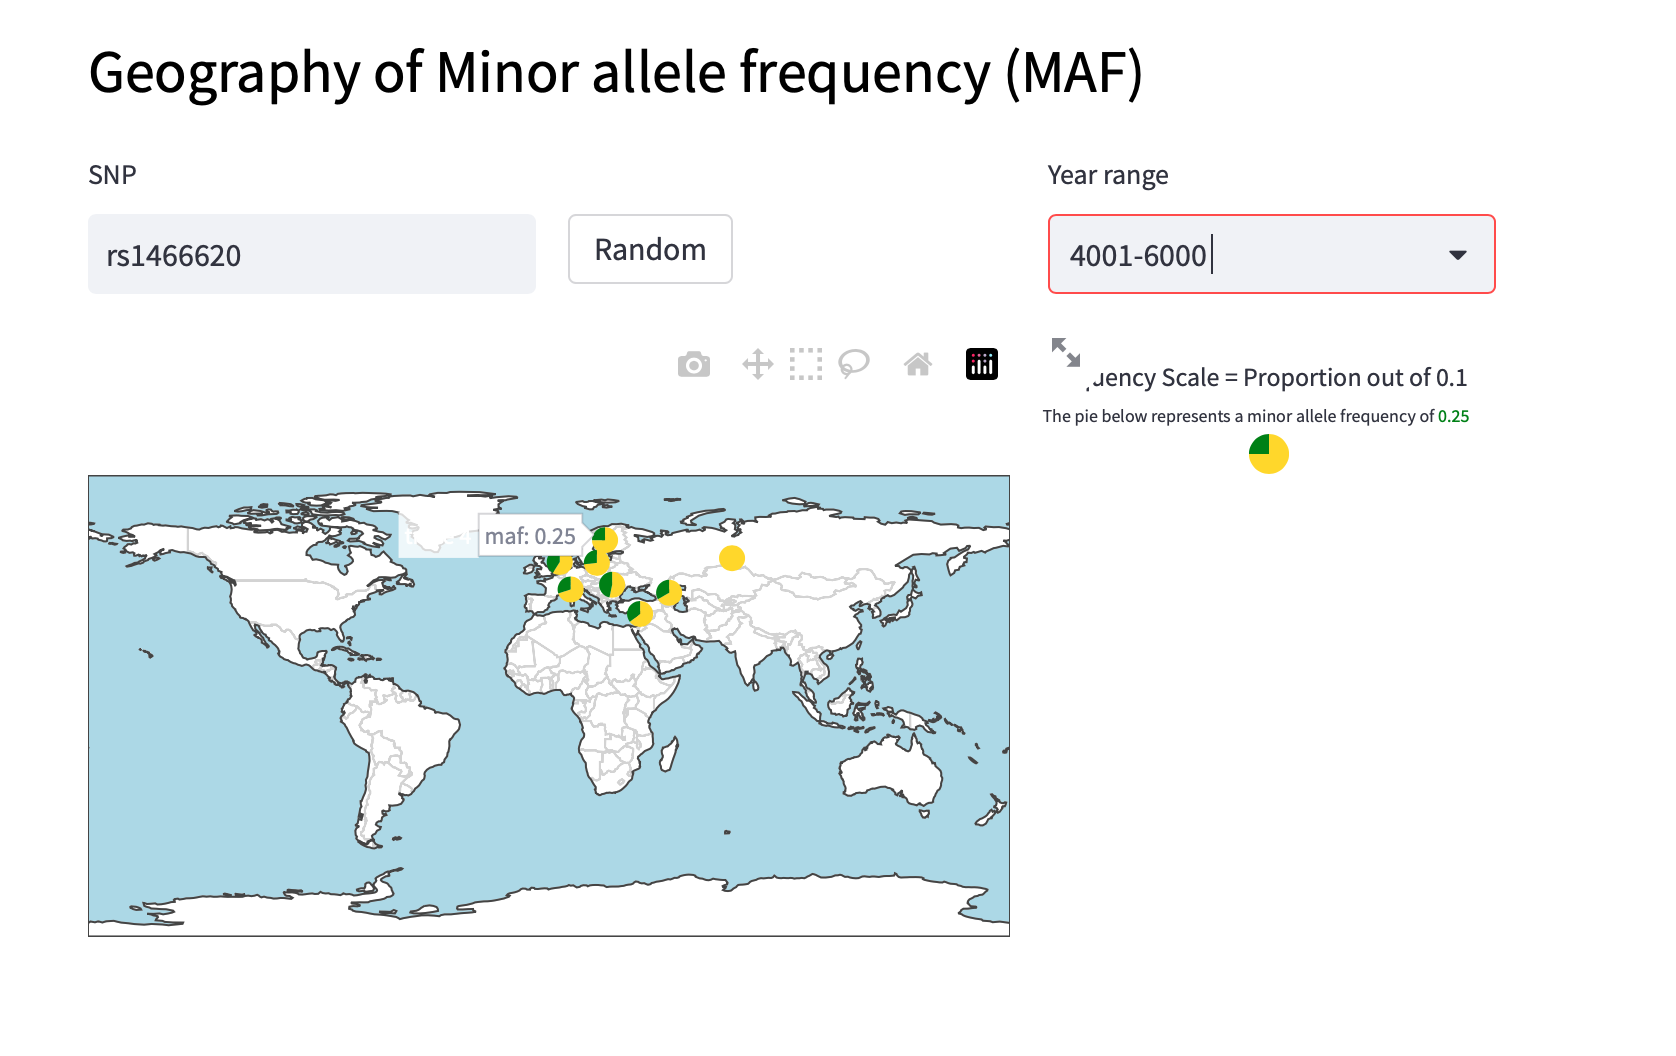
This project is writing a software that shows the minor allele frequency for a chosen SNP in populations for a selected period on worldwide map. The software will be written in python and will be used in a web application. The web application will be written in python using streamlit and is available at https://saghart-population-genetic-project-webaplication-7e56el.streamlit.app/
install plink via conda version 1.9
conda install -c bioconda plink
mkdir Project
cd Project
Download data from this repository:
https://github.com/sarabehnamian/Origins-of-Ancient-Eurasian-Genomes/tree/main/steps/Step%200
DataS1.bed
DataS1.bim
DataS1.fam
Eurasian - Dataset_tims.xlsx
# convert data to ped format
plink --bfile DataS1 --recode --out DataS1The time period is from 0 to 10000 years ago. Data older than 10000 years ago is removed.
With python scipt, TimeSteps.py, years are divided into 5 time periods. 1 time period is 2000 years.
Input:
- Data.xlsx: The Excel file containing data to be filtered
Output:
- Multiple text files, each containing a subset of the filtered data
With python scipt, DataAnalysis.py, minor allele frequency of each SNP for different population in diffeent time period is calculated. Modules to be download: pandas
input: DataS1.ped
- DataS1.bim
- Text files which were prodused by TimeSteps.py
output:
- Json files which contains the minor allele frequency of each SNP for different population in diffeent time period
Cluster populations due to their longtitude and latitude.
#find tha name of all countries
cat DataS1.ped | cut -d' ' -f1 | sort | uniq
A text file countrynames.txt is created and includes the name of all countries, capital of each country and its longtitude and latitude. The file is space separated. I got information from this website: https://www.latlong.net/
The web application is written in python using streamlit, WebApplication.py. In this script, the user can choose a SNP and a time period and the web application shows the minor allele frequency of the SNP in different populations in the selected time period on a world map.
Modules to be download: numpy scikit-learn plotly streamlit
input:
- Json files which were prodused by DataAnalysis.py _ countrynames.txt
output:
- Web application
On your local machine
streamlit run WebApplication.pyOr you can run the web application on the following link: https://saghart-population-genetic-project-webaplication-7e56el.streamlit.app/
A screenshot of the web application is shown below: