Finding performance bottlenecks in a CPU or React profile takes expertise. Handing the full profile to an agent can help, but it fills the context window and burns through tokens.
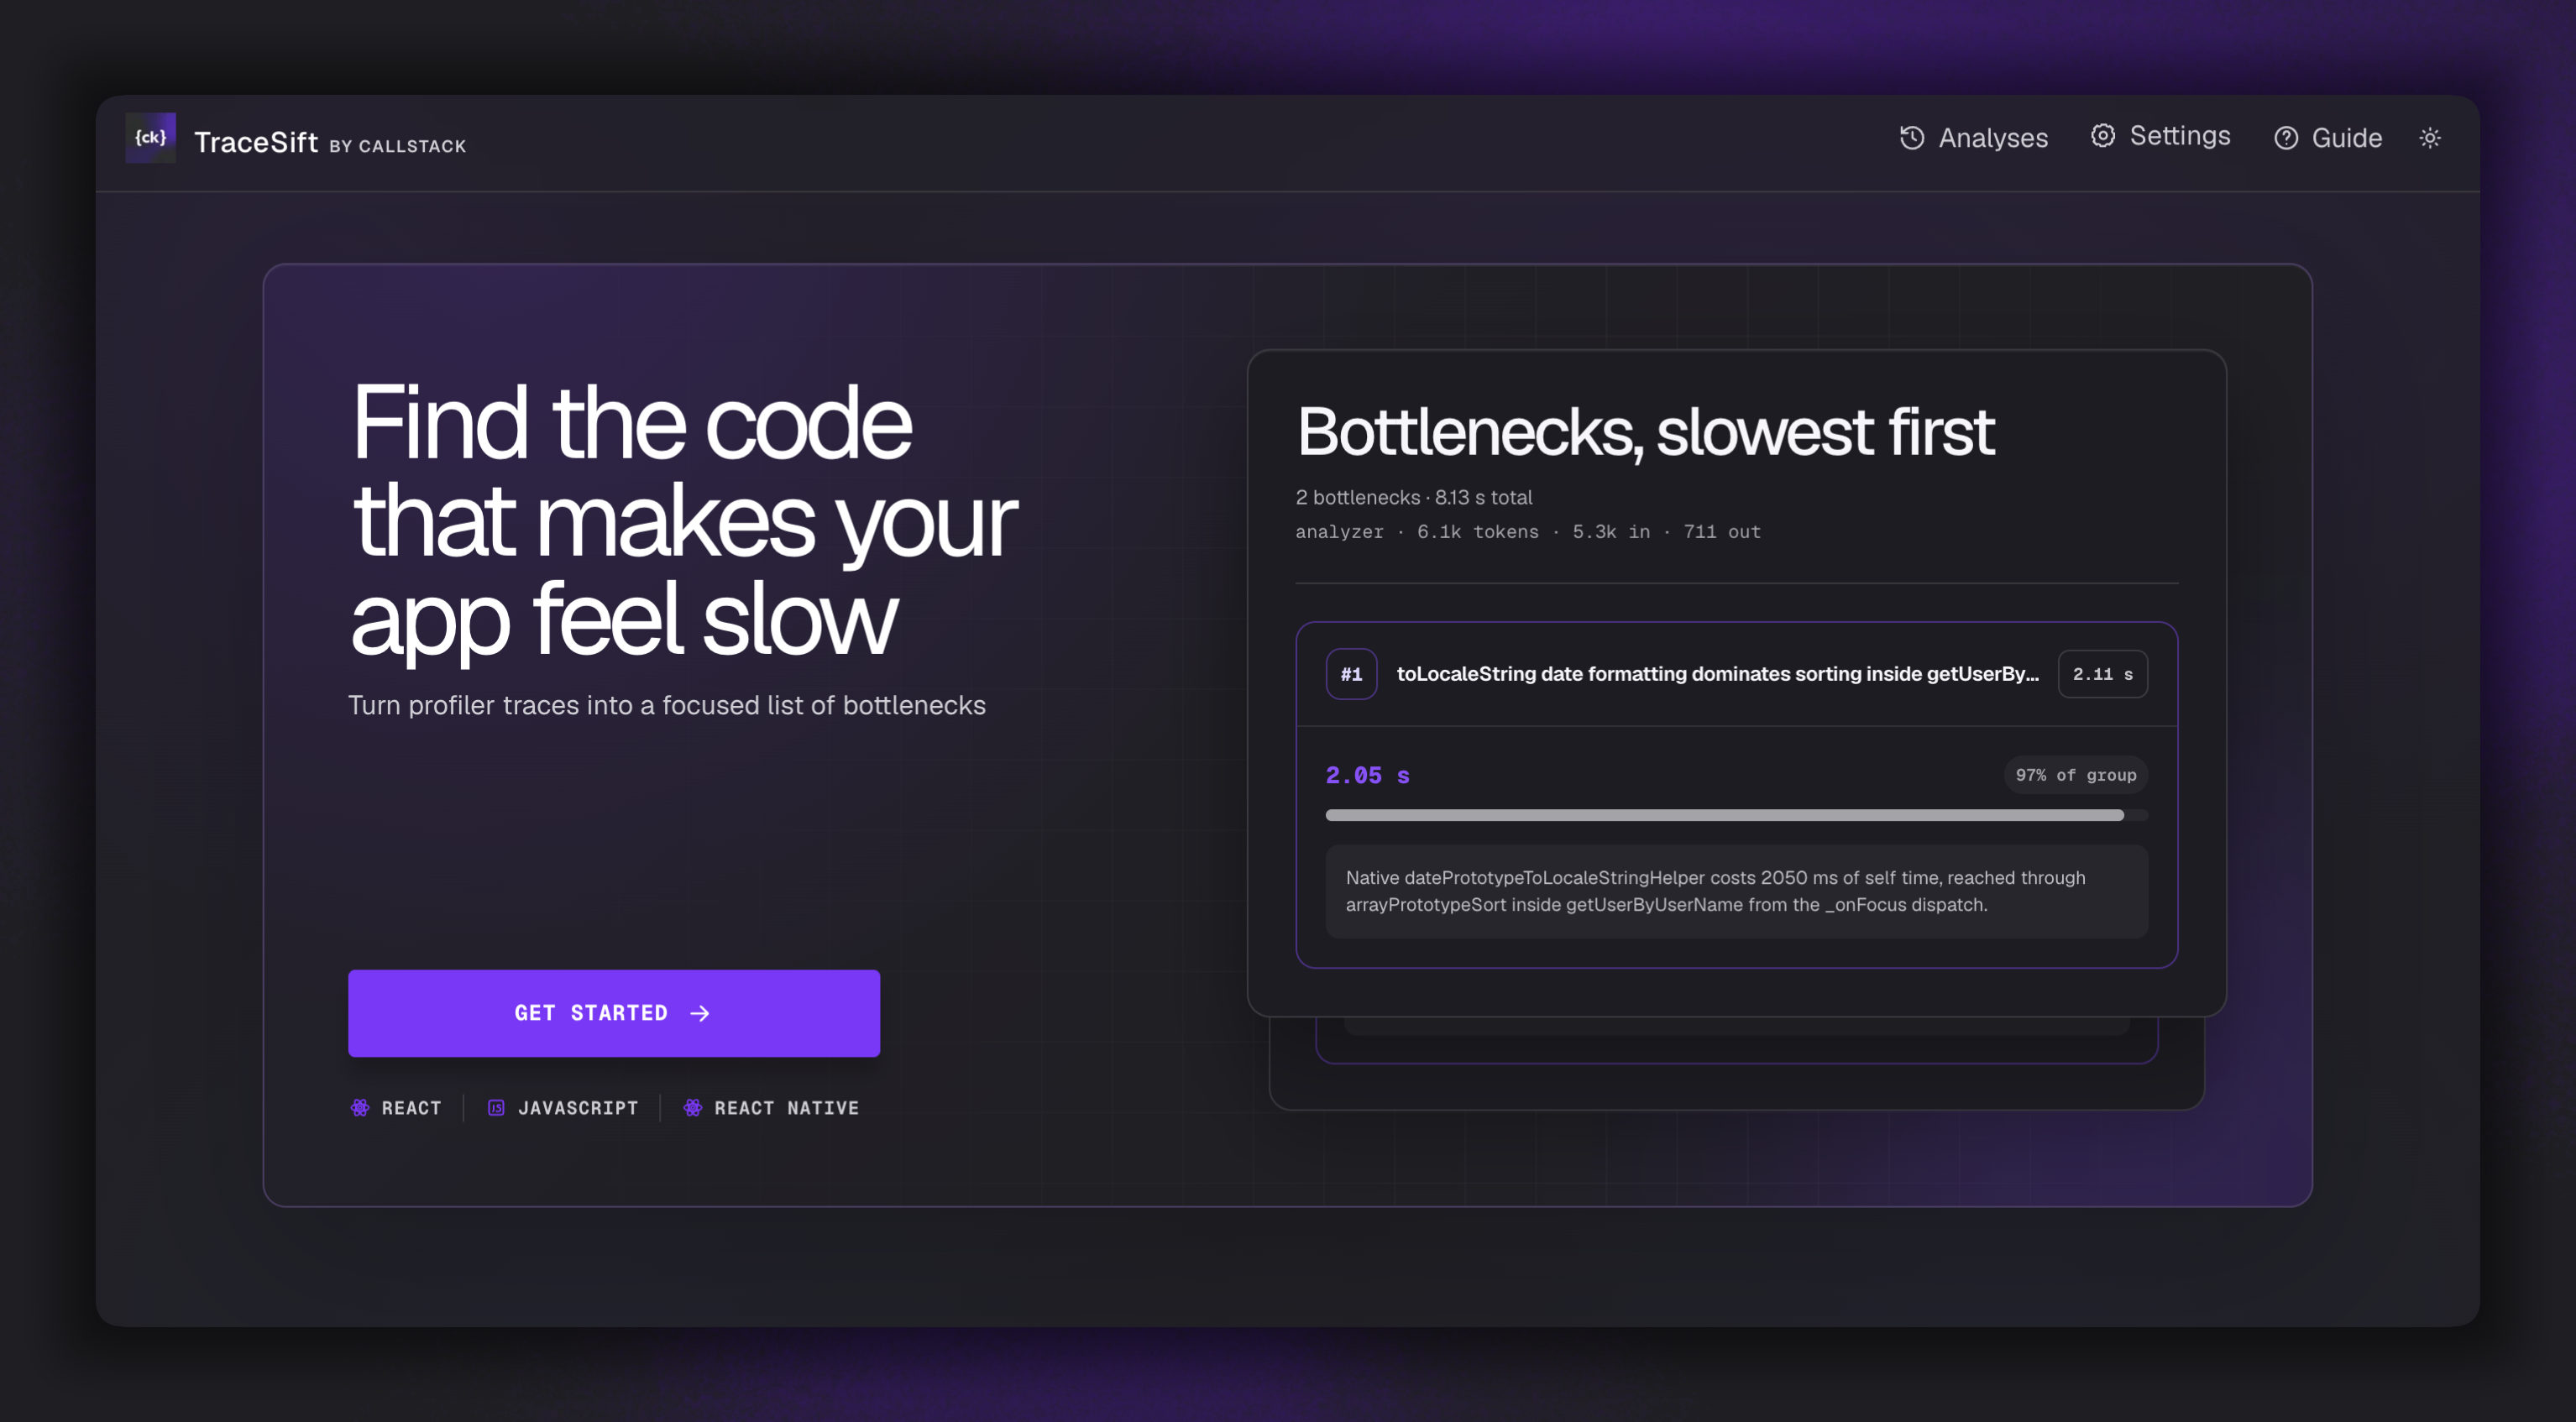
TraceSift identifies bottlenecks in your profile and presents them in a clear, readable format, with the slowest first.
Each bottleneck includes a button to generate or copy a handoff prompt, so your agent can continue the investigation in the source code. You decide what gets fixed; the agent does the work.
Runs locally with OpenAI, Anthropic, or Callstack Apex. Your credentials stay with you.
npm install -g @callstack/tracesiftInstalls the TraceSift command globally. Requires Node.js 22.19 or newer and npm on macOS or Linux. The installed command does not need Git or build tools.
tracesift initRun this once to download and verify the prebuilt web app for your platform. After updating the CLI, run tracesift init again to install its matching app release.
tracesift startStarts TraceSift at http://127.0.0.1:3000 and opens it in your browser. Press Ctrl+C to stop the server.
See the CLI documentation for storage, troubleshooting, and release details.
Contributors can run npm run test:release:local to verify the packaged download and startup flow against a loopback artifact server before any GitHub release. See Contributing for the manual browser checkpoint and Changesets release process.
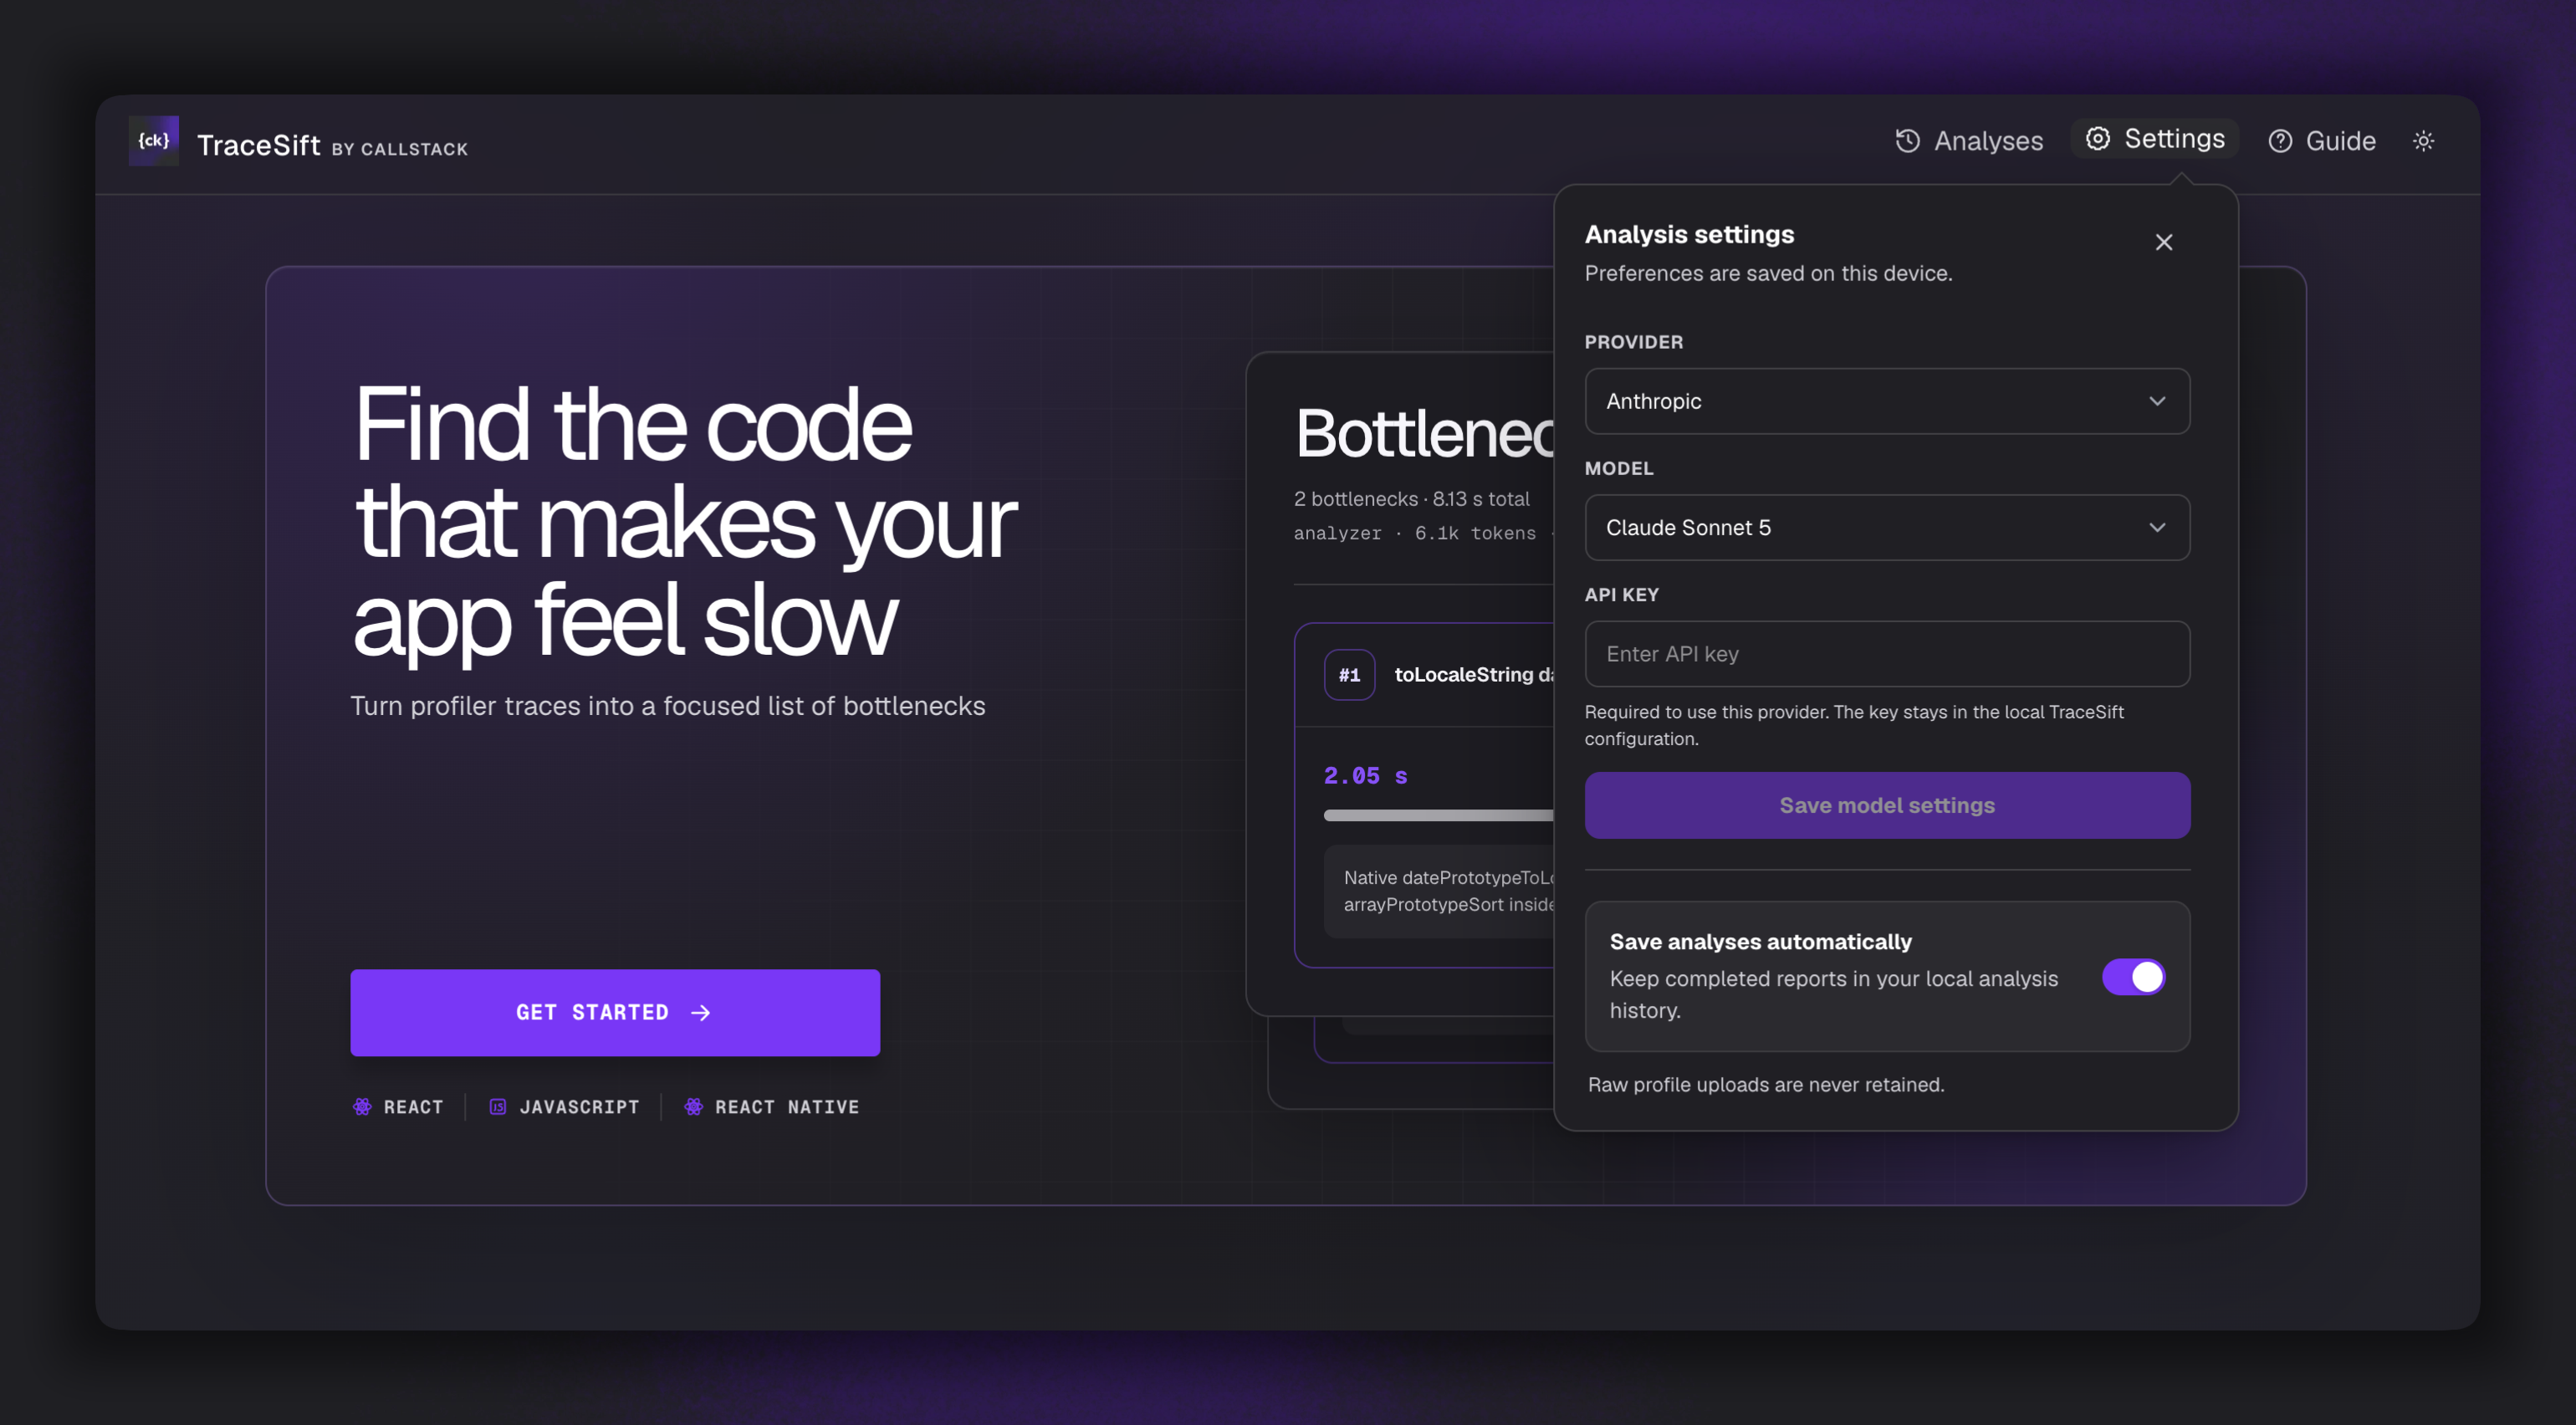
Open Settings before your first analysis. Choose a provider, authentication method, and model, then select Save model settings.
- OpenAI and Callstack use API keys;
- ChatGPT Codex uses Plus/Pro subscription sign-in;
- Anthropic supports a Claude subscription or API key.
- Browser sign-in is available.
- Subscription sign-in uses PI OAuth experimentally.
- Connecting an account does not select a model automatically.
- Credentials stay in the local TraceSift home directory.
- TraceSift never reads PI's own auth file.
Enable Save analyses automatically to keep completed reports in local history, or disable it and save individual reports from their results page.
Clicking on "Save model settings" is required.
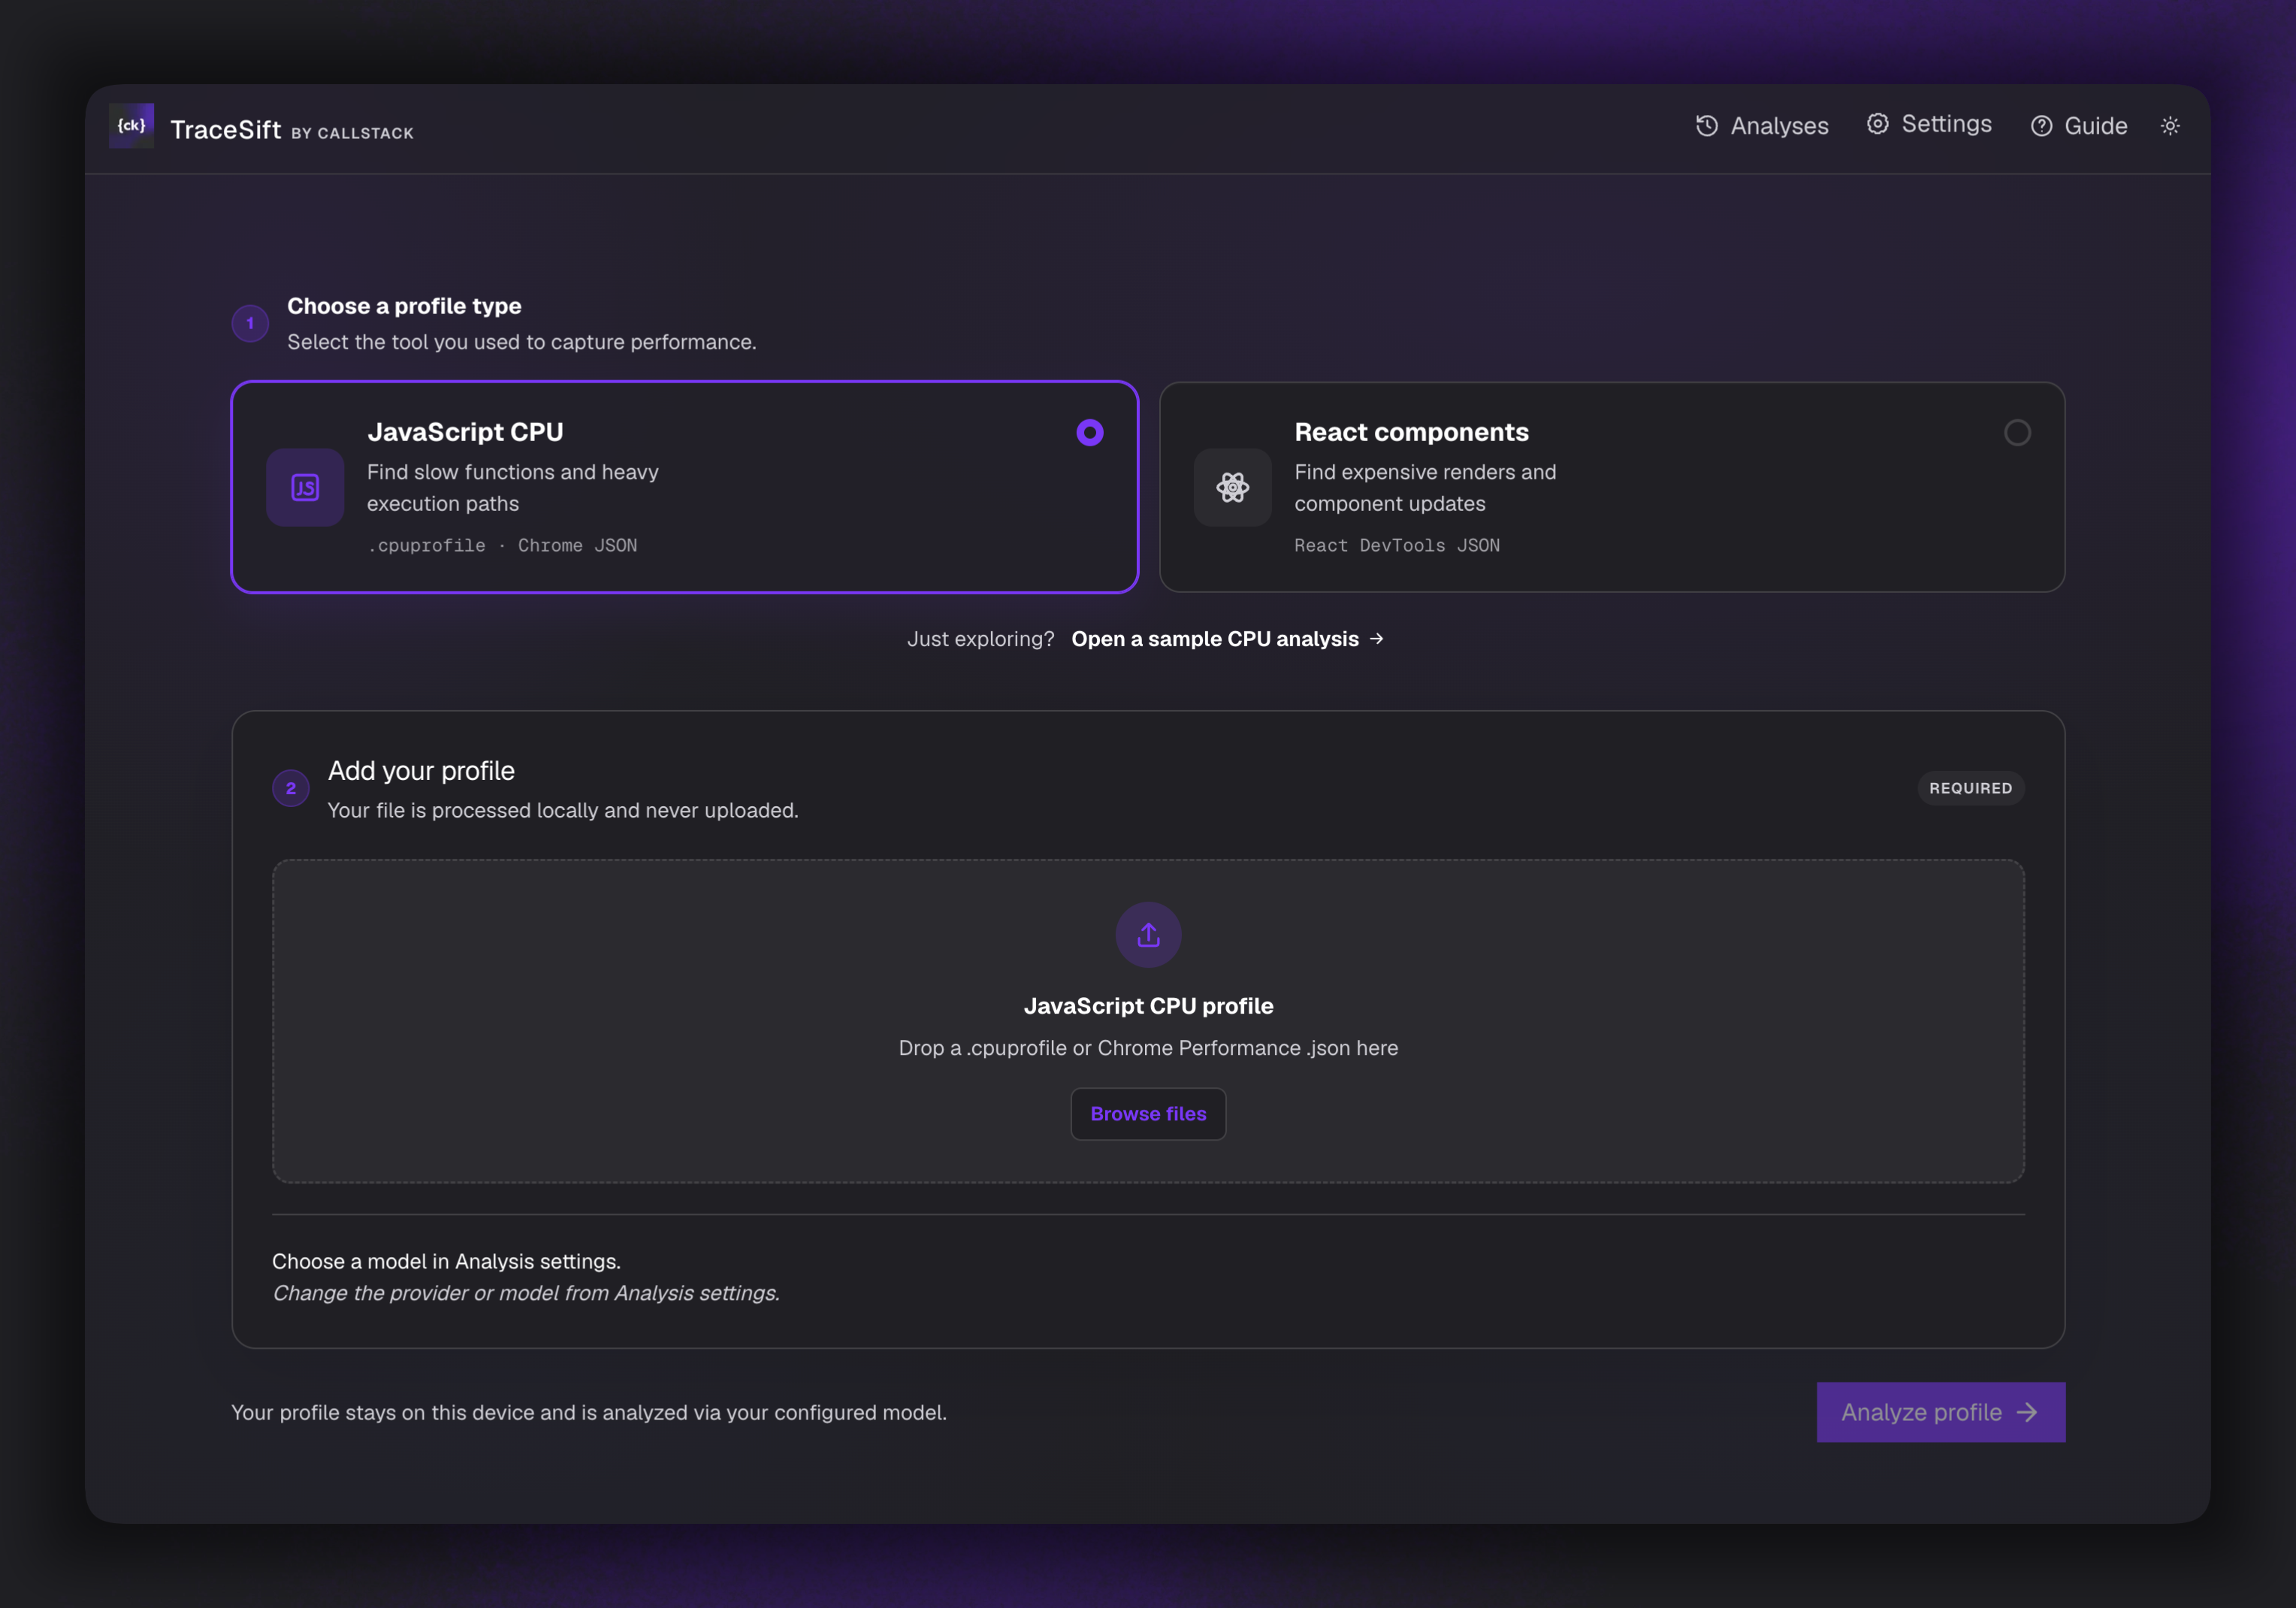
Select Get Started, then choose the profile type that matches the profiler you used, then click on "Analyze Profile".
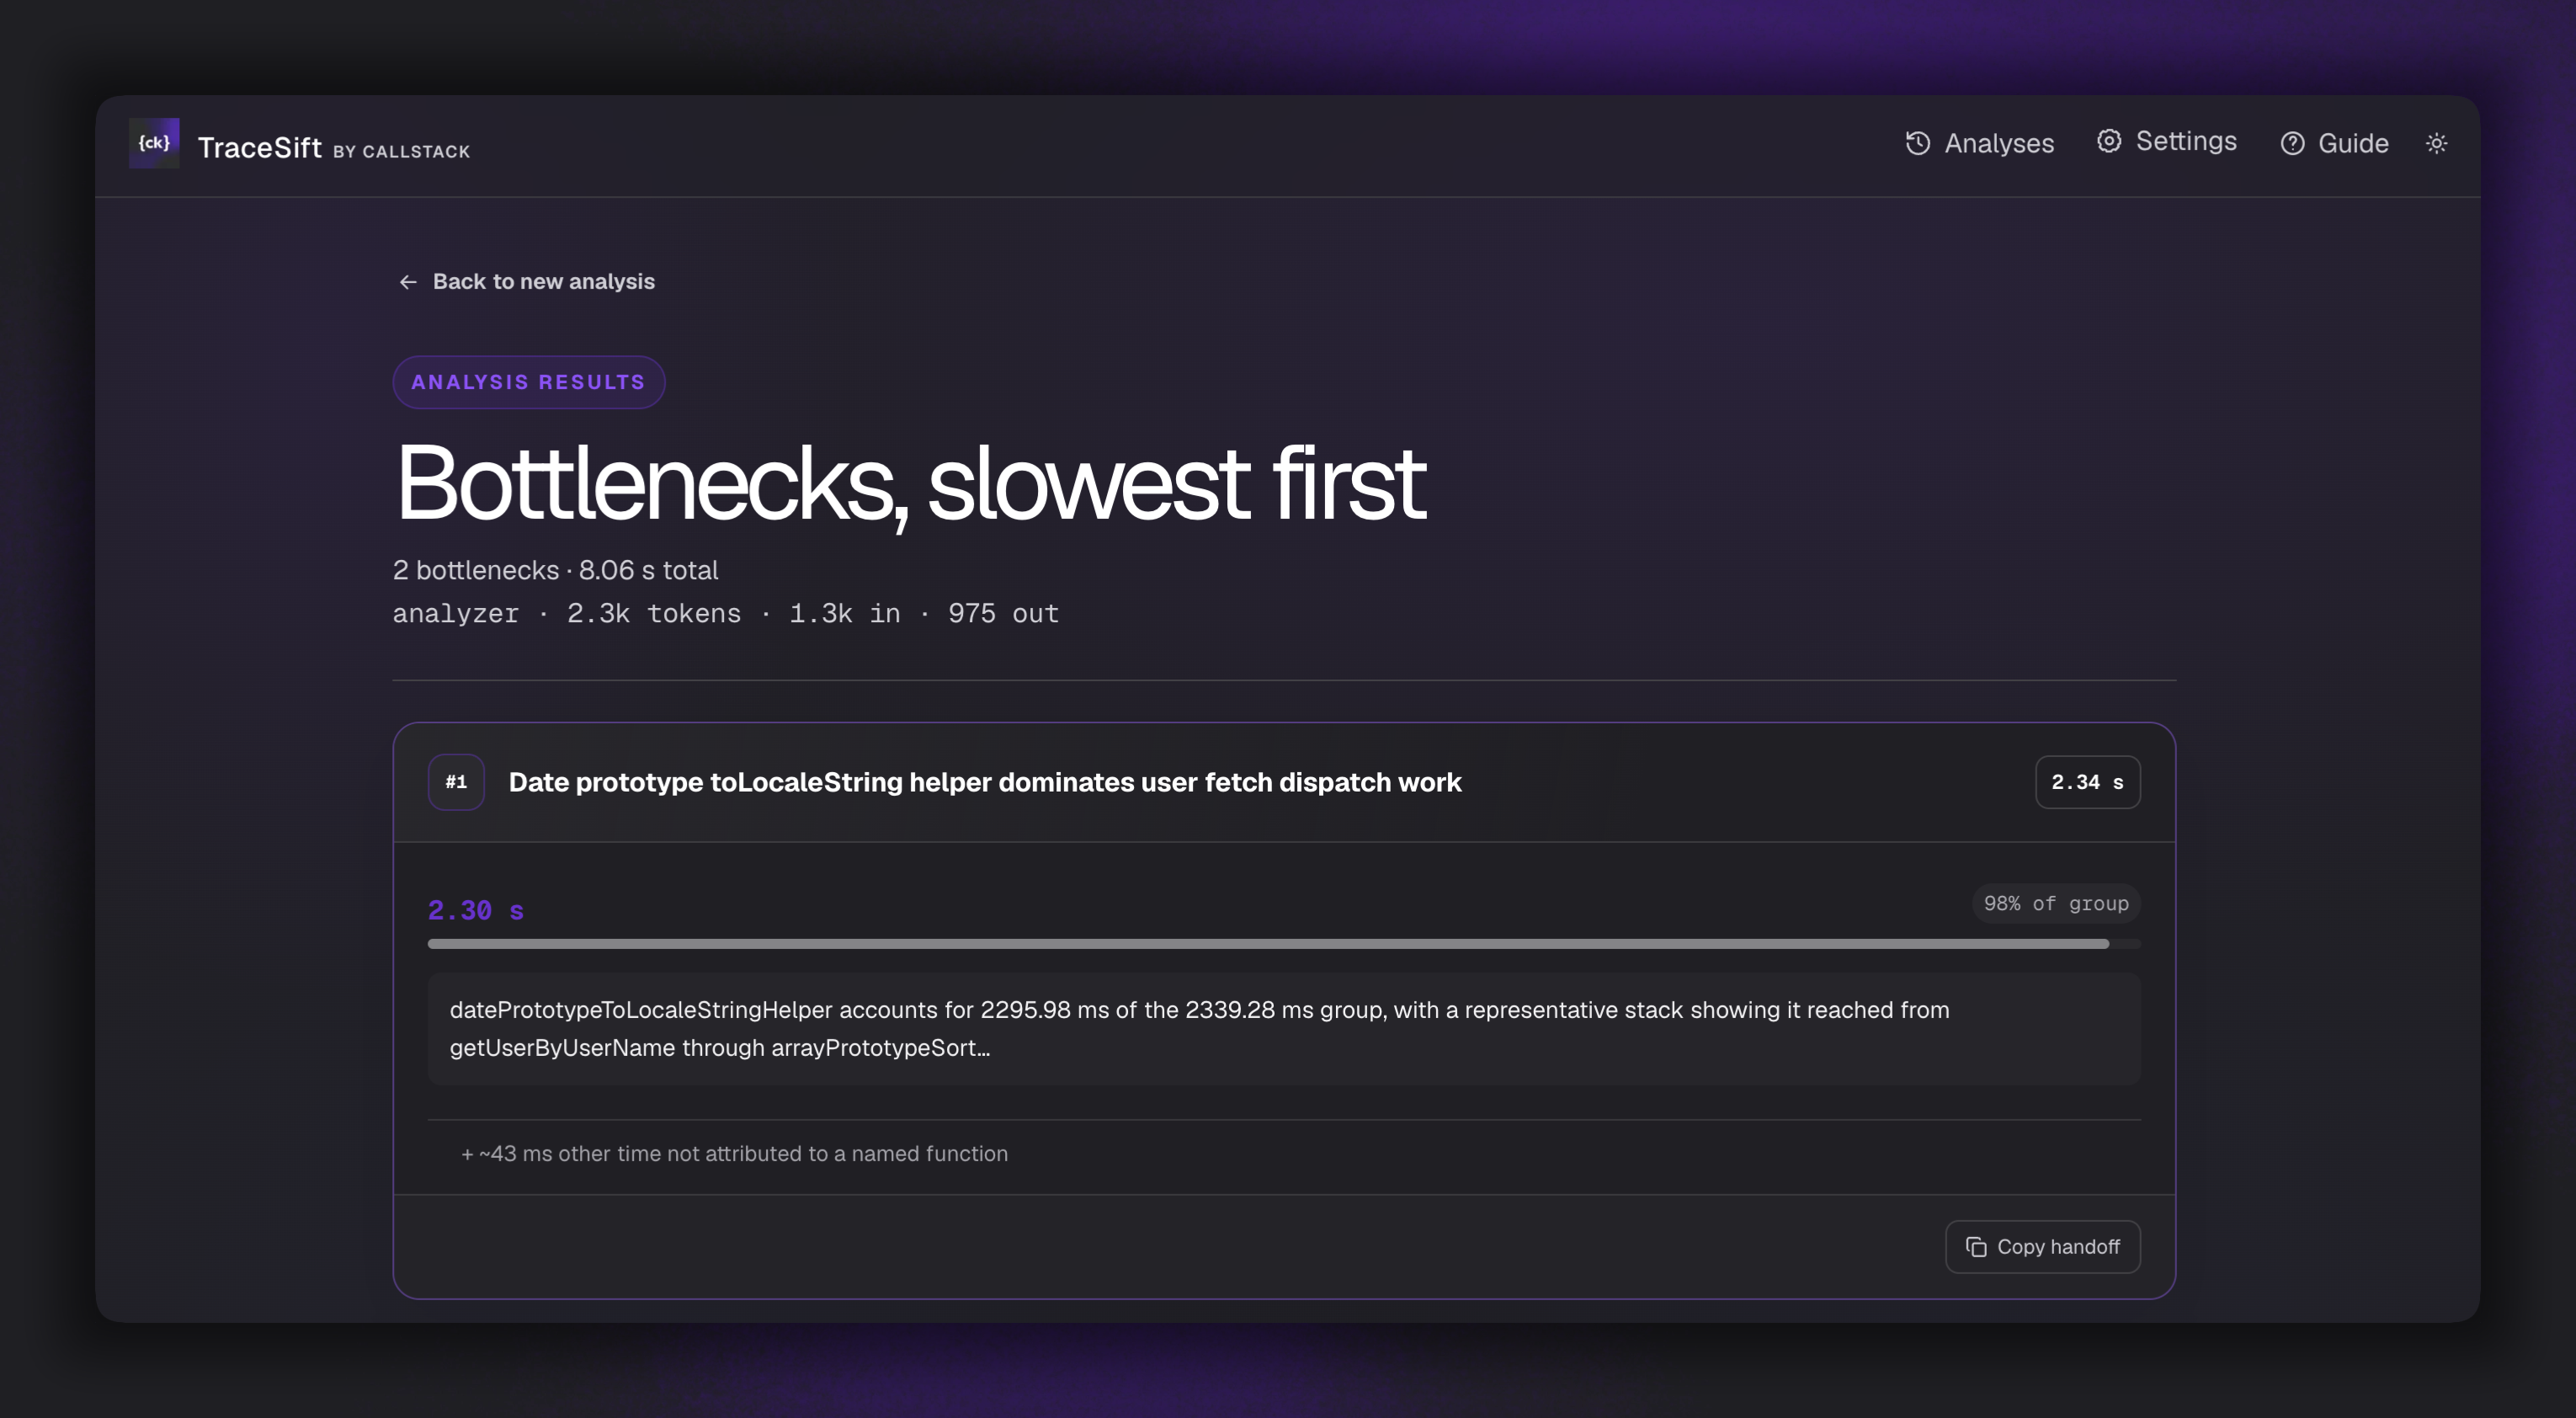
Visualize the results sorted by slowest. Each card provides a short summary of from where the issue originates and its impact on the recorded flow.
Visualize the results sorted by longest to render. Each card provides a short summary of from where the issue originates and its impact on the recorded flow.
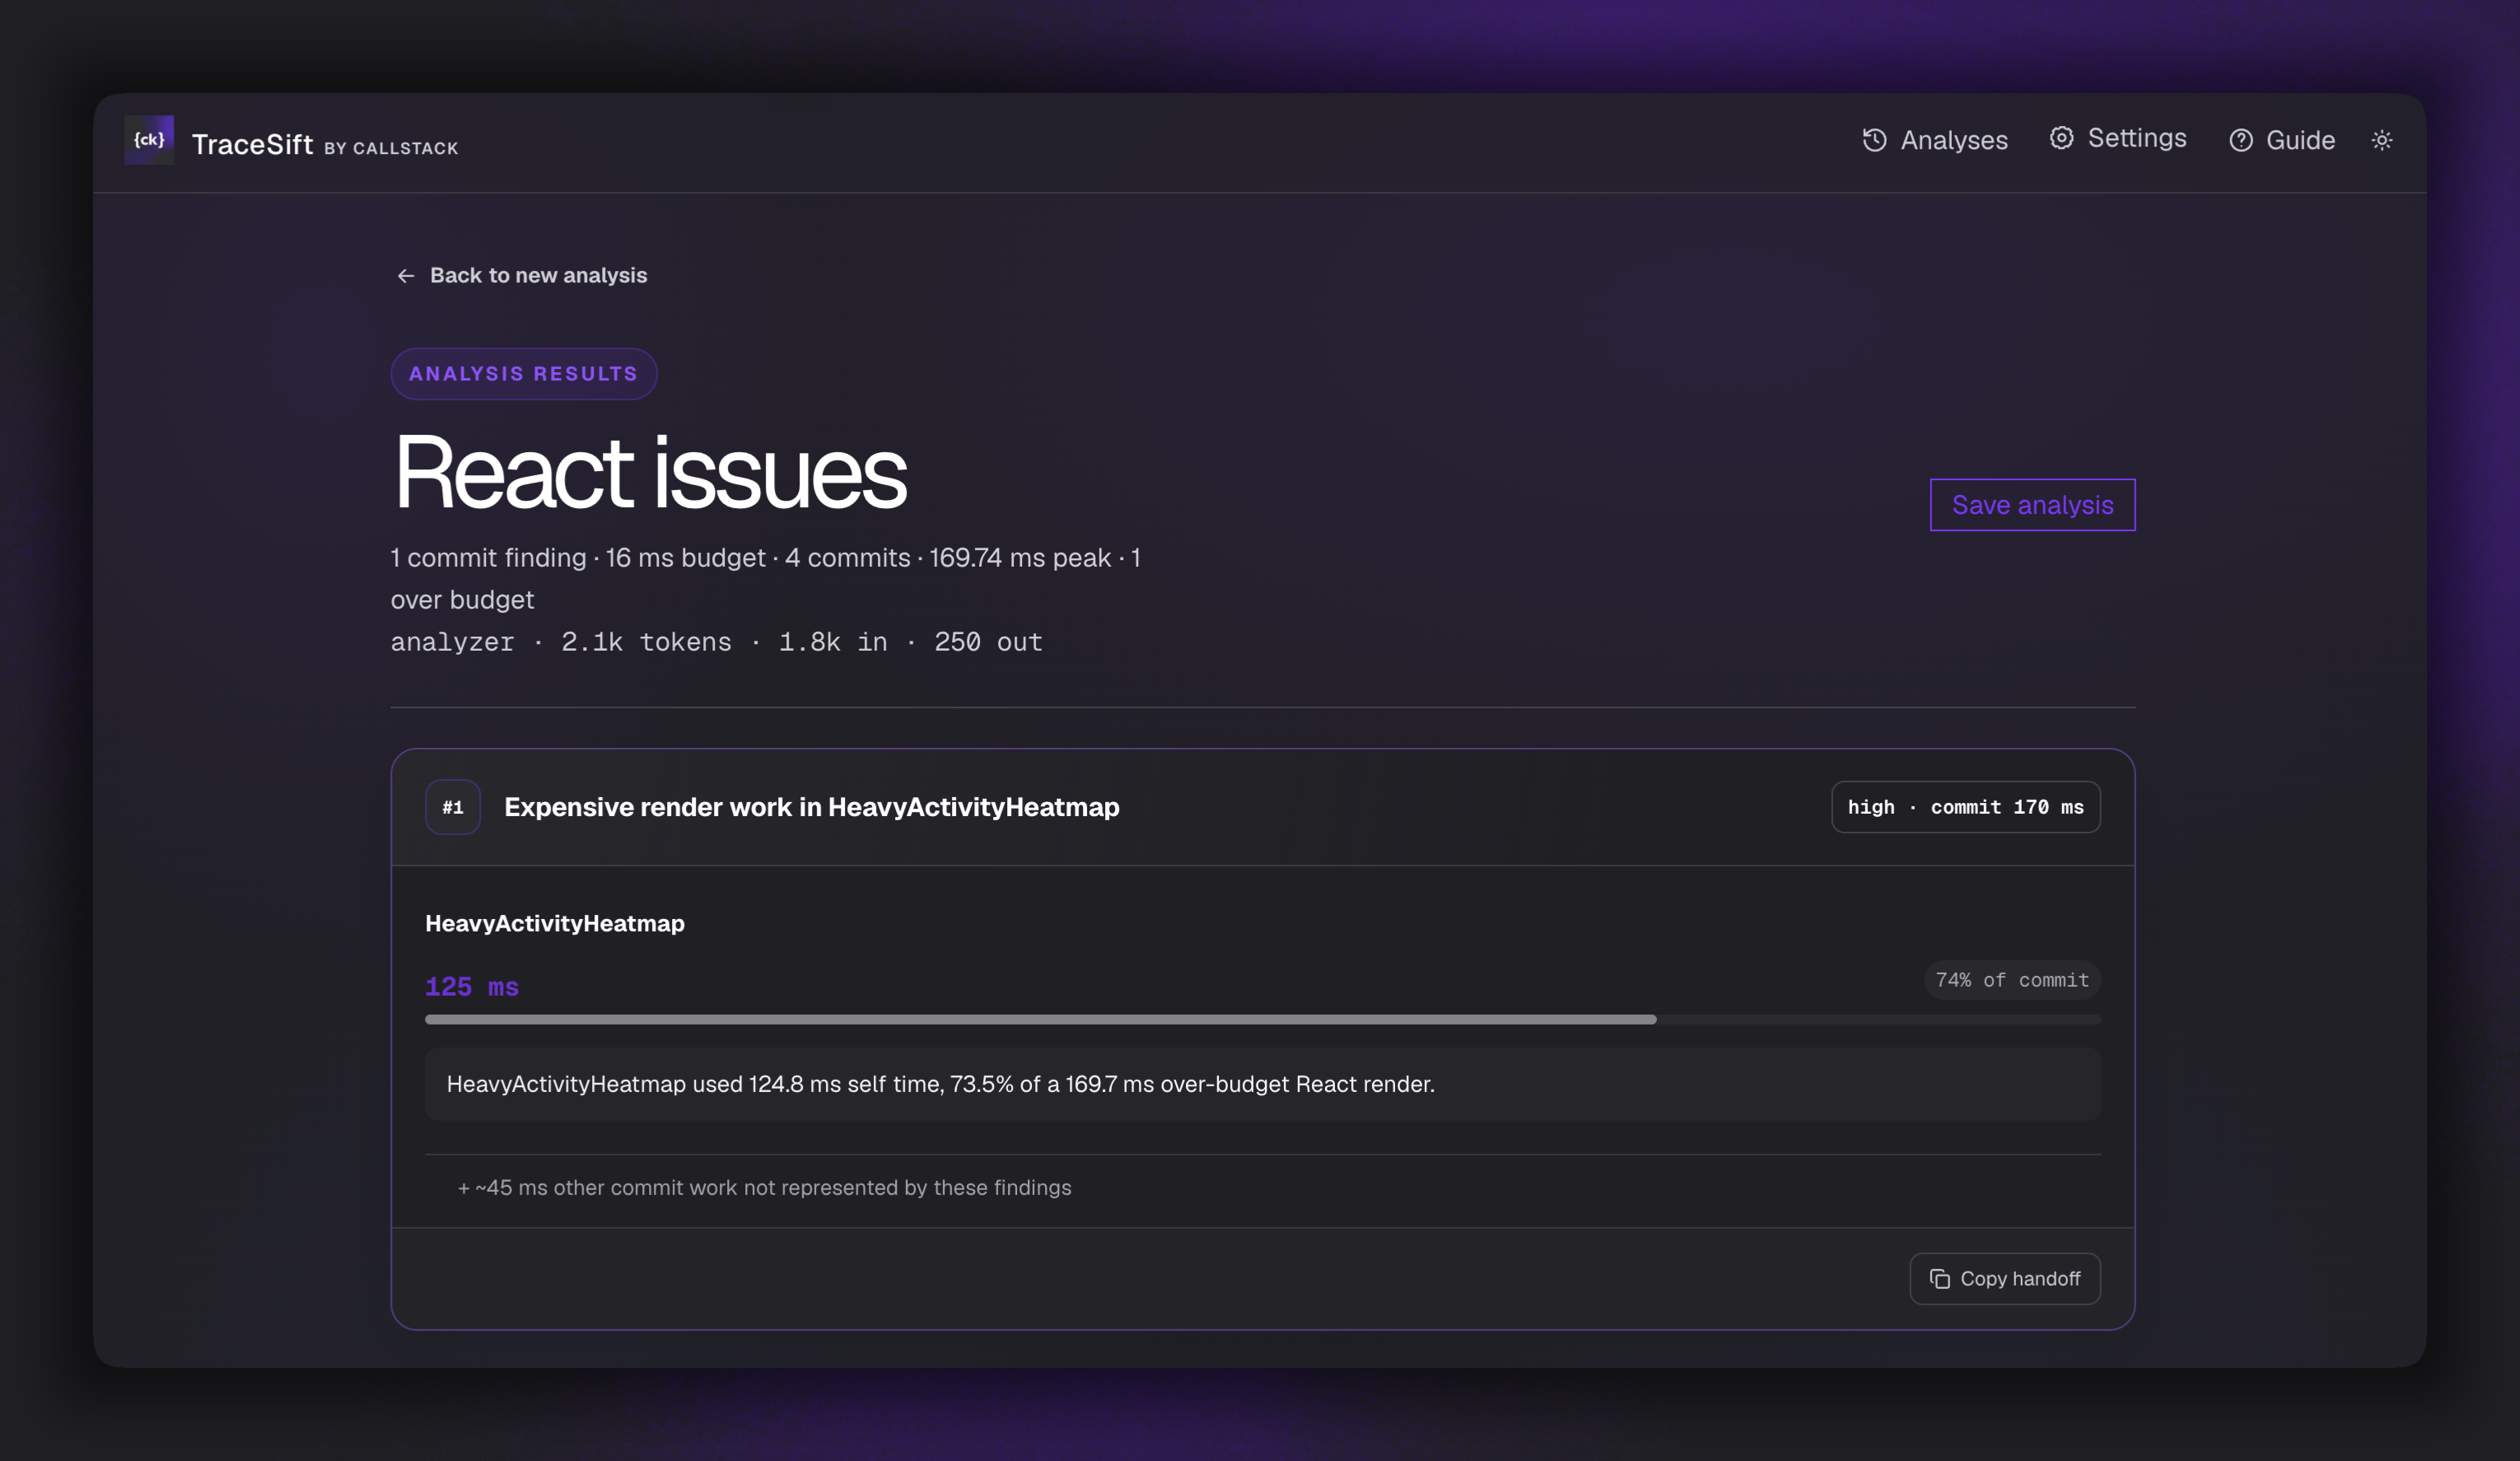
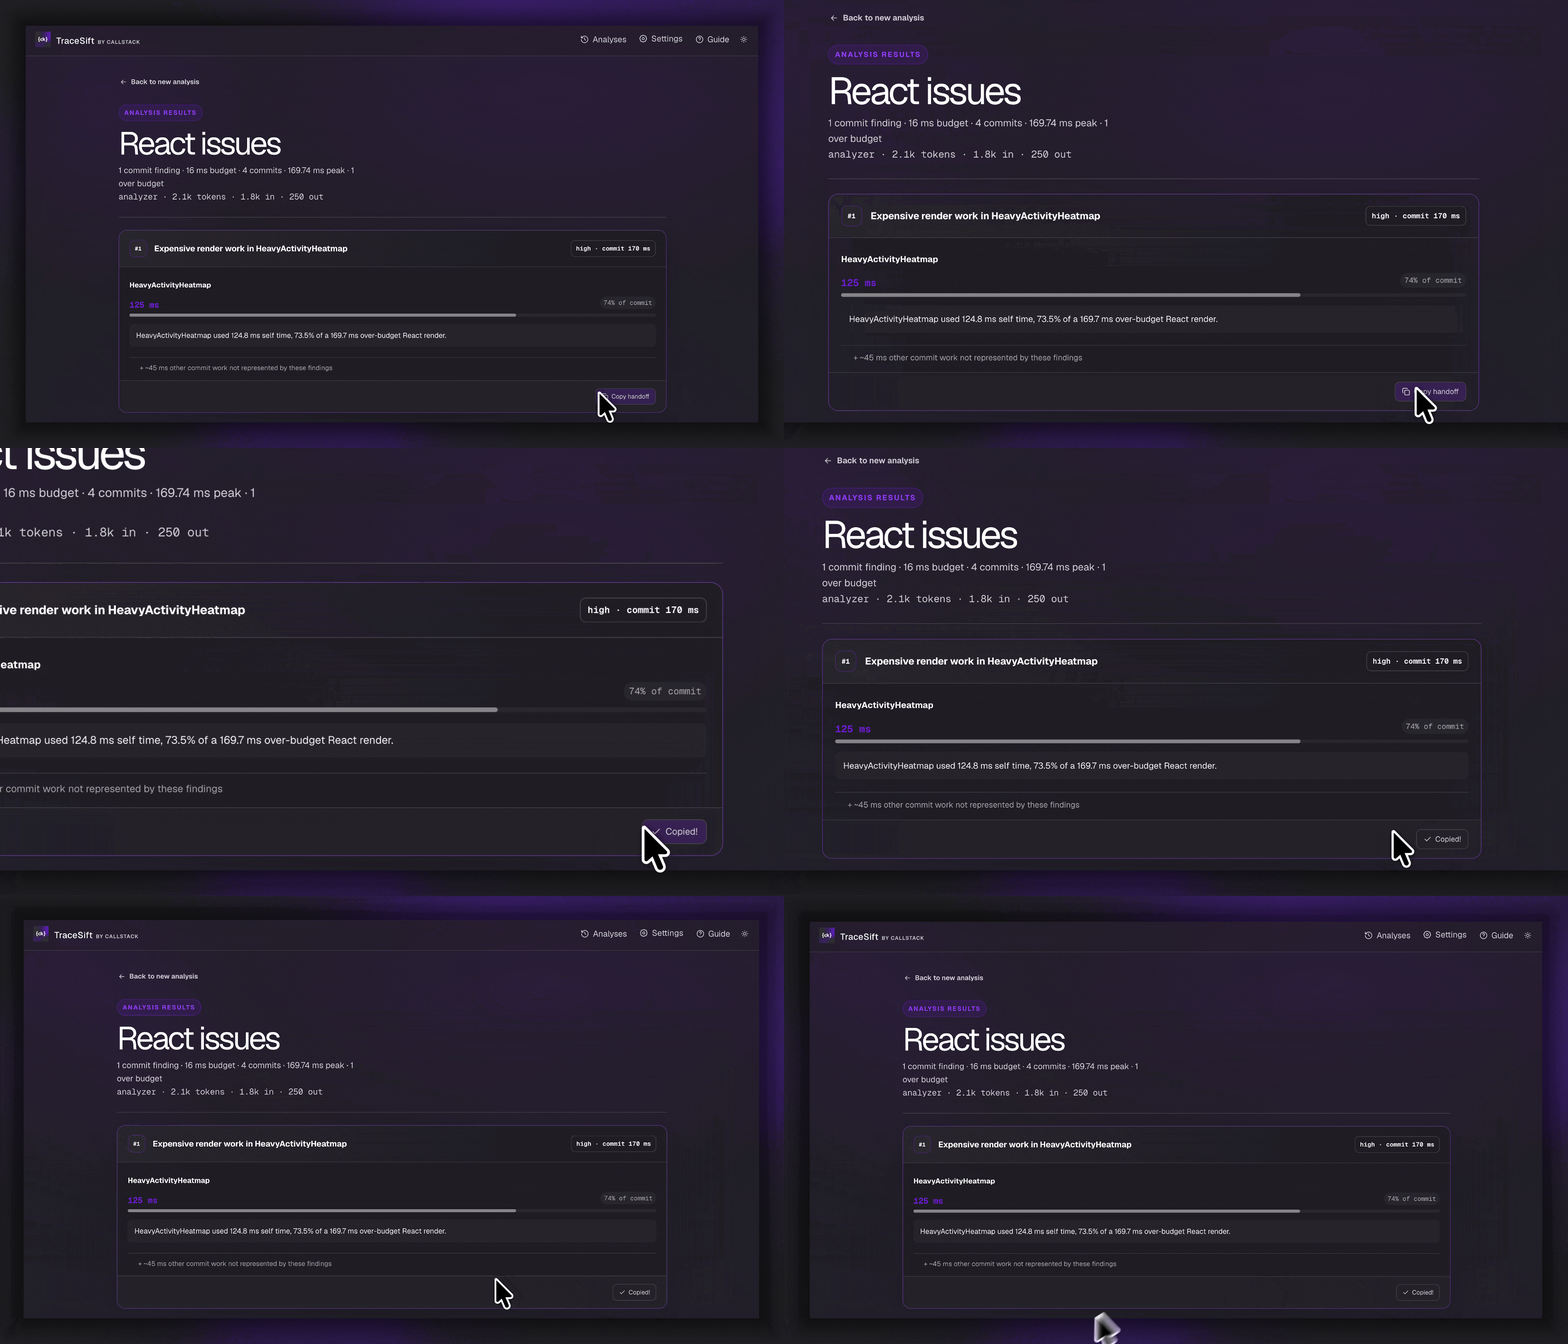
When the bottleneck or React issue cards appear, choose the card you want to investigate and select Copy Prompt.
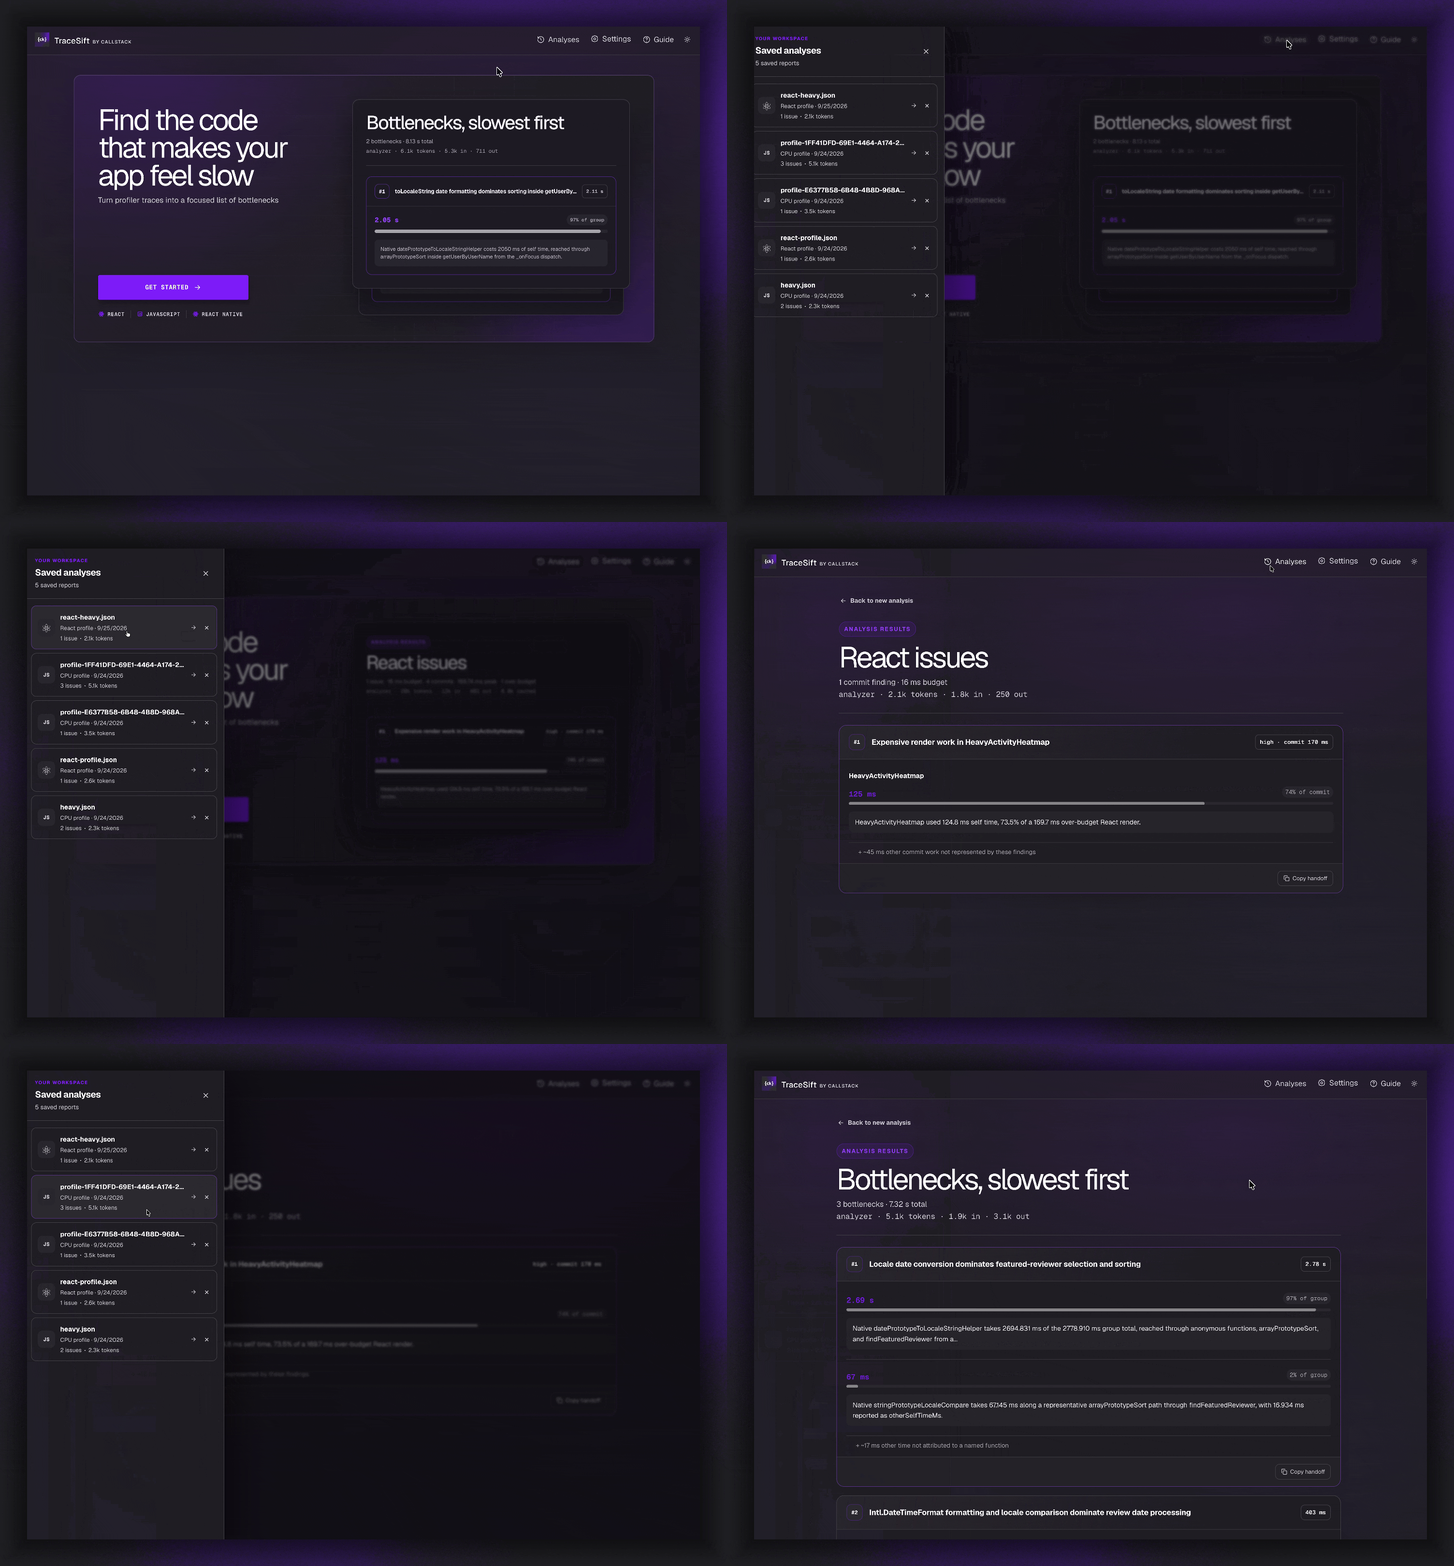
Open Analyses to browse locally saved reports, including their findings and generated prompts. Select a report to reopen it, or delete reports you no longer need.
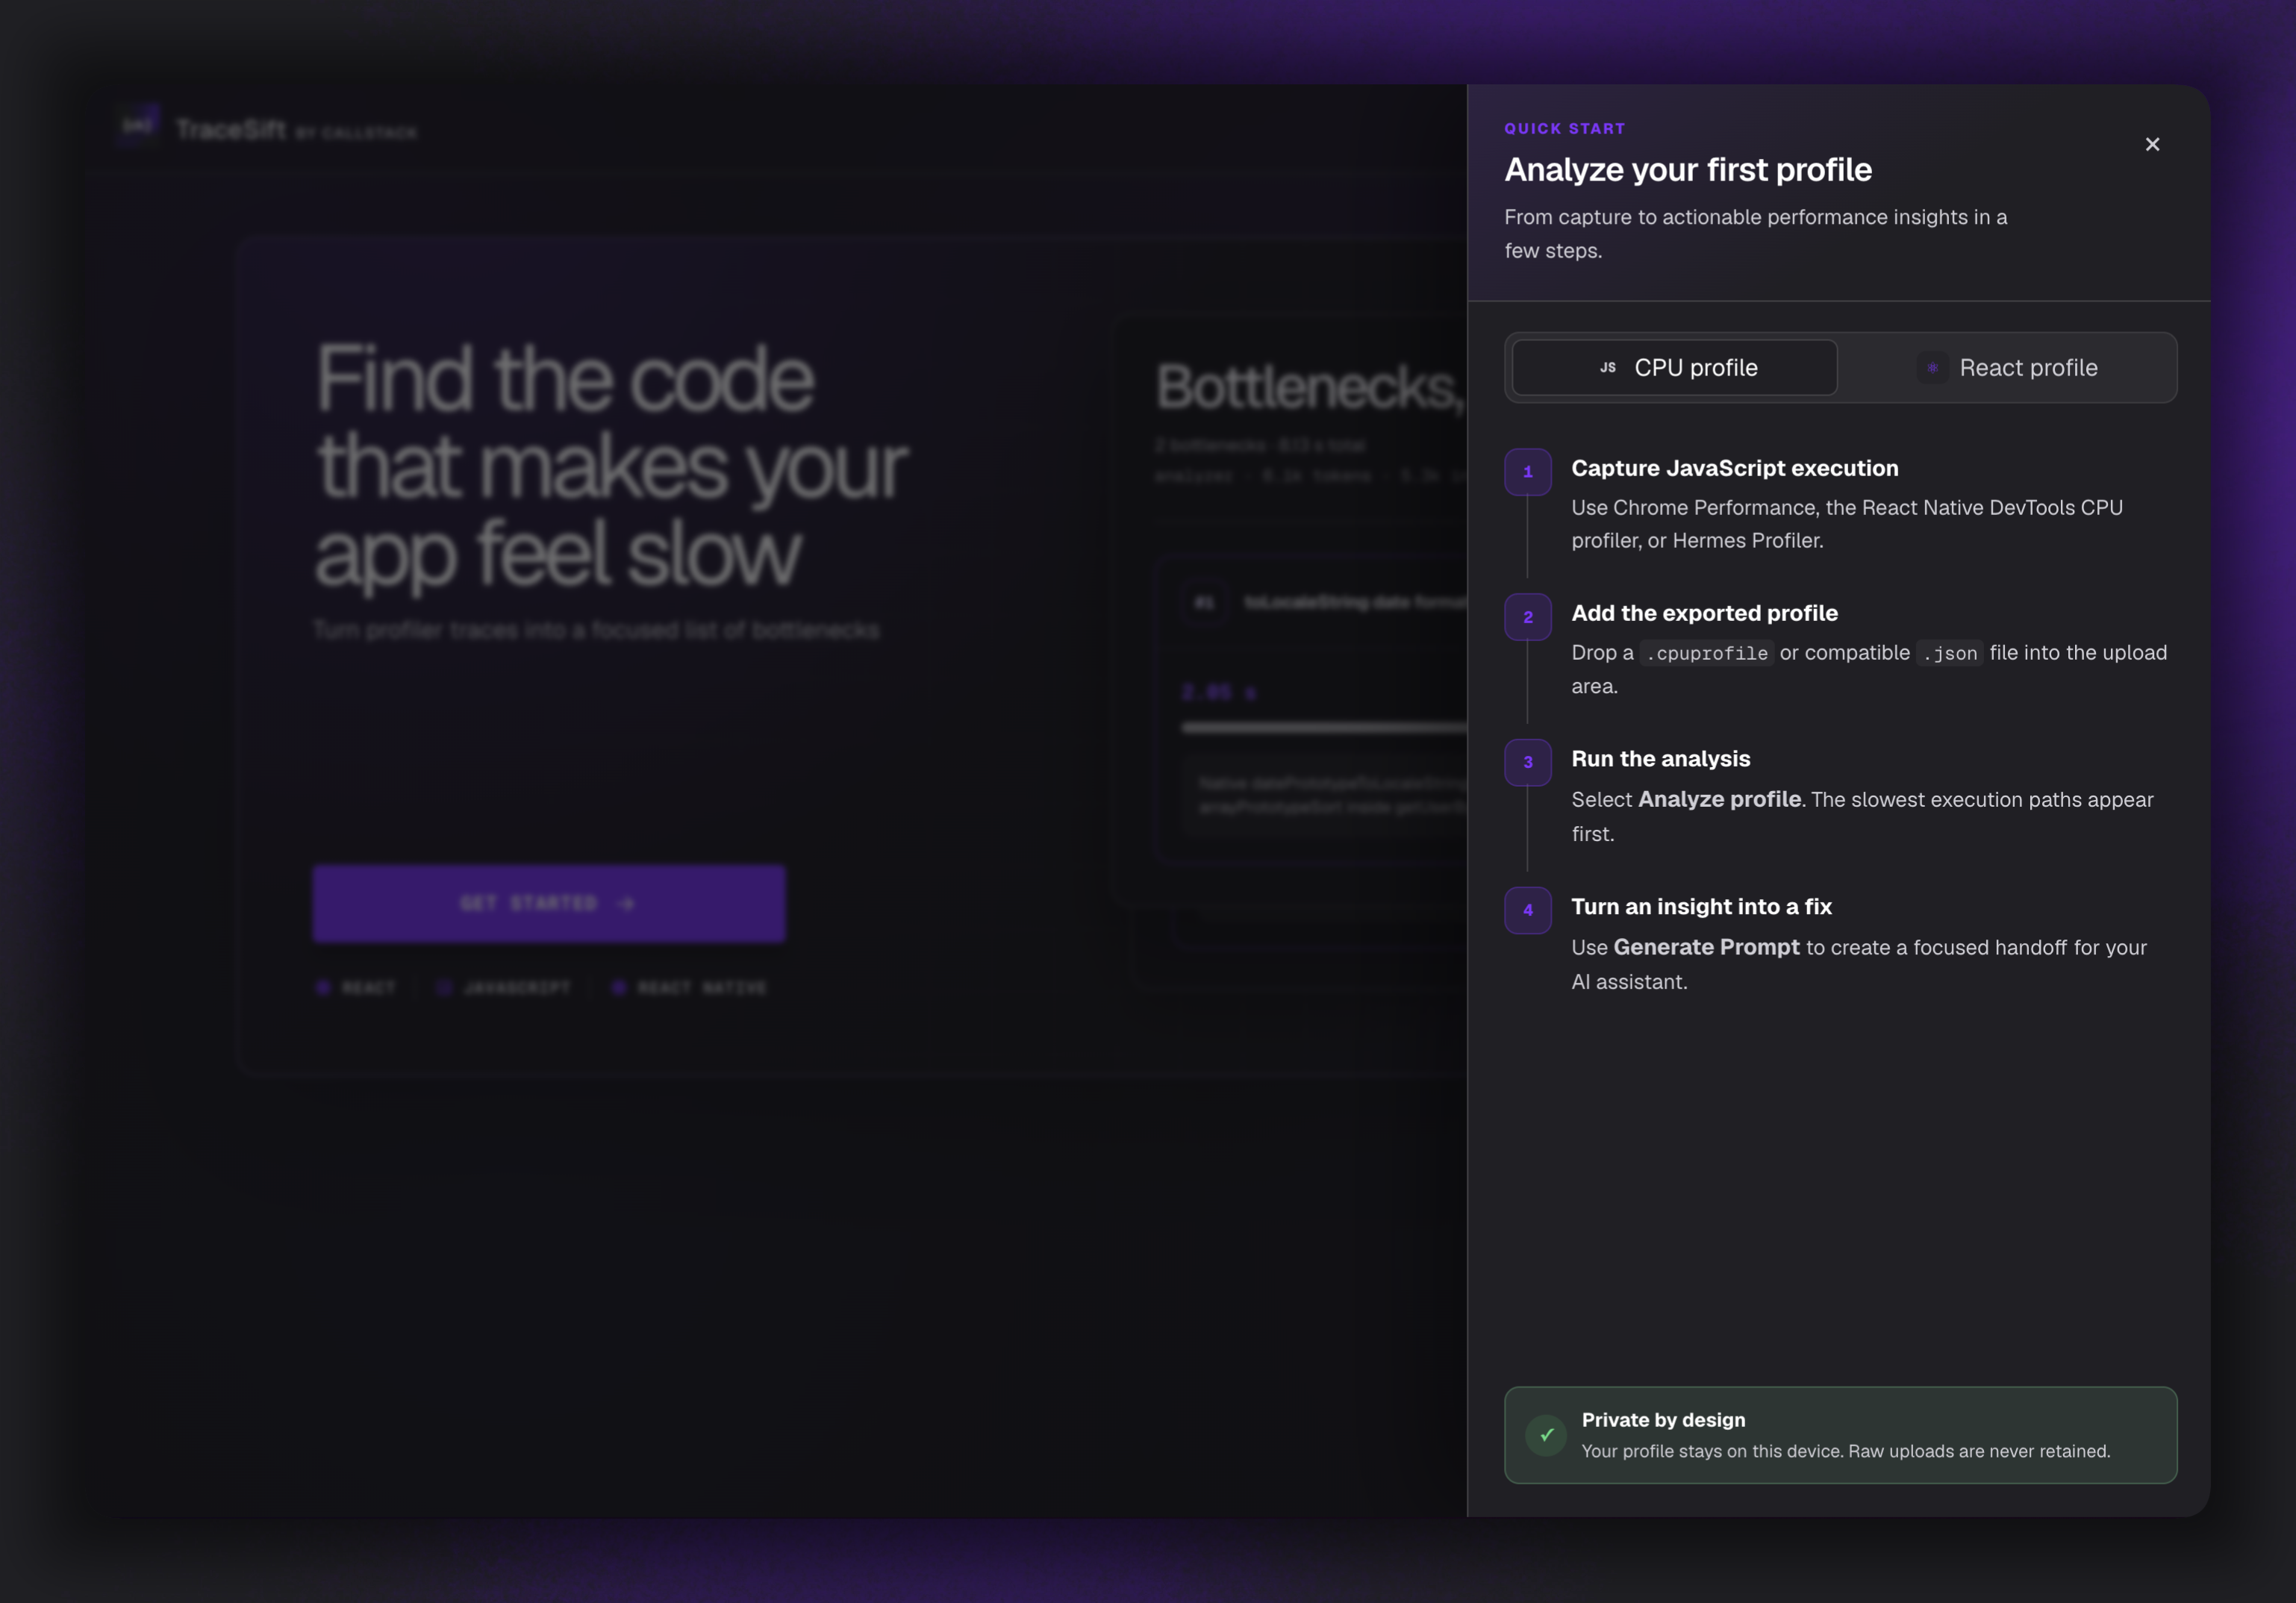
Select Guide for built-in, step-by-step instructions for capturing and analyzing JavaScript CPU, Hermes, and React profiles.
See CONTRIBUTING.md for setup, manual testing, automated checks, and testing the managed CLI installation.
The CLI package lives in packages/cli; it exports shared configuration, catalog, and server-runtime modules and uses the same pinned agent SDK version as the app.
TraceSift is an open source project and will always remain free to use. If you think it's cool, please star it 🌟.
Callstack is a group of React and React Native geeks, contact us at hello@callstack.com if you need any help with these or just want to say hi!
MIT