Repository navigation
feat(dashboard): readable hover cards for tiles and charts - #147
Merged
hiddify-com merged 4 commits intoNov 1, 2026
Merged
Conversation


Hovering a top tile showed its numbers as wrapped "label: value" lines of
white text on the dark tooltip. It is now a light card in the page's
colours: the tile's icon and name, then one row per number with the label
at the start and the value, bold, at the end. The tile's own number comes
first in the tile's colour; dark mode and RTL follow the theme.

Co-Authored-By: Claude Opus 5.5 <noreply@anthropic.com>
…ss themes

- Every dashboard chart shows the page-text tooltip (it was the canvas one
  in left-to-right languages) as the tiles' card: the hovered point on top,
  a row per series (its colour, its name, the value in bold at the end),
  totals under a dashed line (_chart-tip.scss).
- A tile's sparkline tip: the day quiet, the value bold in the line's
  colour.
- The colour (glass) themes make the content background see-through, so
  the page's text showed through these cards; they get a solid surface
  there.

Co-Authored-By: Claude Opus 5.5 <noreply@anthropic.com>
The tip (day and value) is position: fixed, but the tile lifts on hover with
a transform, which makes the tile its containing block: the tip landed as
far below as the tile is from the top of the page, often behind the cards
below. It is rendered in <body> now (Teleport), and under the pointer so
it does not cover the tile's big number.

Co-Authored-By: Claude Opus 5.5 <noreply@anthropic.com>
A tile with a hover card set cursor: help, so the pointer turned into a
question mark over the four tiles; it stays the usual pointer now.

Co-Authored-By: Claude Opus 5.5 <noreply@anthropic.com>

This file contains hidden or bidirectional Unicode text that may be interpreted or compiled differently than what appears below. To review, open the file in an editor that reveals hidden Unicode characters.
Learn more about bidirectional Unicode characters
Sign up for free
to join this conversation on GitHub.
Already have an account?
Sign in to comment


Add this suggestion to a batch that can be applied as a single commit.This suggestion is invalid because no changes were made to the code.Suggestions cannot be applied while the pull request is closed.Suggestions cannot be applied while viewing a subset of changes.Only one suggestion per line can be applied in a batch.Add this suggestion to a batch that can be applied as a single commit.Applying suggestions on deleted lines is not supported.You must change the existing code in this line in order to create a valid suggestion.Outdated suggestions cannot be applied.This suggestion has been applied or marked resolved.Suggestions cannot be applied from pending reviews.Suggestions cannot be applied on multi-line comments.Suggestions cannot be applied while the pull request is queued to merge.Suggestion cannot be applied right now. Please check back later.
Problem
Hovering the dashboard's top tiles showed their numbers as wrapped
label: valuelines of white text on a dark tooltip ("vs previous 7 days: 346 / MB"), which was hard to read. The charts' hover tooltip was a canvas box in left-to-right languages and a plain list in right-to-left ones. On the colour (glass) themes,--p-content-backgroundis see-through, so the page's text showed through these cards.Change
StatTile.vue/KpiTiles.vue:details(label/value pairs) instead of one string.escape: falsewith escaped values, classkpi-tip) is a card: the tile's icon and name on top, then one row per number with the label at the start and the value in bold at the end. The tile's own number comes first, in the tile's colour.dashboard.tip.*strings in 7 languages).useChartTheme.ts+_chart-tip.scss: every chart now uses the page-text tooltip, in both directions, with the same look: the hovered point on top, a row per series (colour dot, name, value in bold), and totals under a dashed line. The inline styles moved into classes.Sparkline.vue: a tile's sparkline tip shows the day in muted text and the value in bold, in the line's colour.Sparkline.vue: the tip is rendered in<body>(Teleport). The tile lifts on hover with atransform, which makes the tile the containing block of theposition: fixedtip: it landed as far below as the tile is from the top of the page, often behind the cards below. It shows under the pointer, so it doesn't cover the tile's big number.StatTile.vue: no morecursor: helpover the tiles (it turned the pointer into a question mark).--p-surface-0/--p-surface-900), asNodePingPanelalready does.Screenshots
A tile's sparkline tip, with the pointer on the "Week usage" sparkline (before: not visible at all, behind the cards below):
A chart in English, after (it was a canvas tooltip before):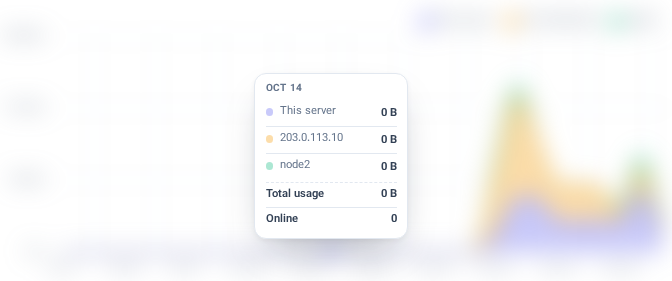
The chart canvases are blurred by the screenshot tool, because their legends hold node names.
The Nodes page's live charts (
NodeLiveCharts.vue, the sameMetricChartwithpage-tooltip) get the same card, solid on a glass theme. Reported by admins: on a glass theme the text behind the tooltip ("Show less") showed through it.Tested
cursor: helpleft.vue-tsc: no errors in the changed files.Review
🤖 Generated with Claude Code