


Charts for data that never stops. Prices, metrics, sensors, logs.
Wick Charts draws realtime, animated charts on canvas for React, Vue and Svelte. Give a series an array. When the array changes, the last point eases to its new value, new points join at the edge, and the view follows them. Zoom, pan, crosshair and tooltips work without extra code. There are no runtime dependencies besides your framework.
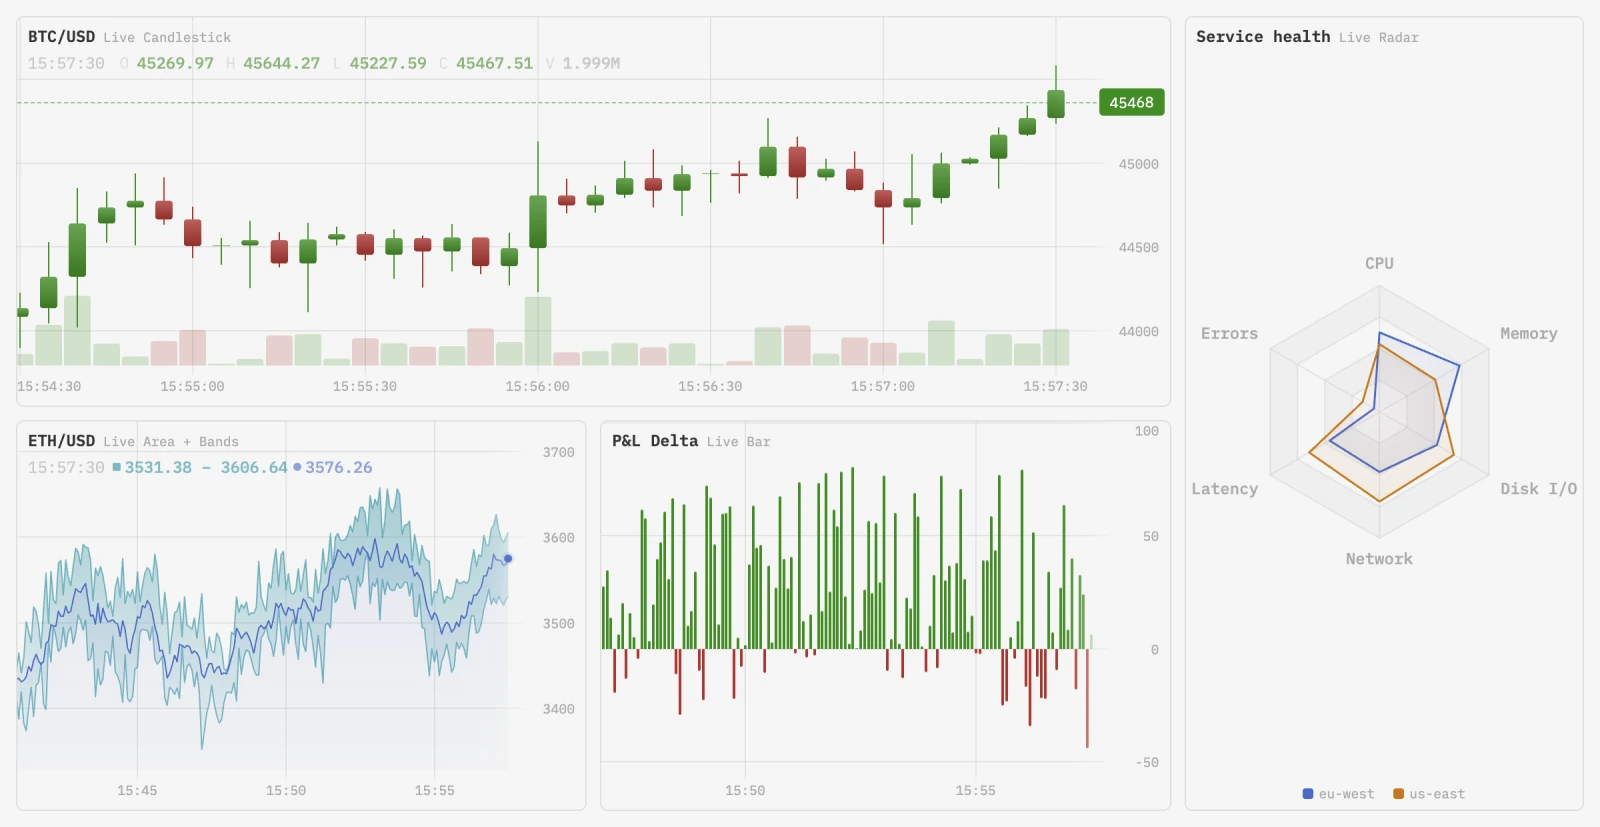
Live demo · Documentation · Theme editor
Each type has a page in the docs with a live playground. Change a setting, and the Code tab next to it shows the code for what you see.
- Candlestick, order book, line and area, band, bar, histogram
- Sparkline, a small chart with no axes for a table row or a card
- Pie and donut, heatmap, Sankey, gauge and radial progress, radar

Lines and bars stack, as values or as percents of the total. The X axis takes time, plain numbers or categories, and a second series can use its own Y scale.
Pass a new array to data when the data changes. The series compares it with the previous array:
- A changed last point eases to its new value.
- A few new points at the end are appended.
- Anything else replaces the data.
The view follows the newest point. Pan back into history and it stays where you put it; pan back to the end and it follows again. The Realtime Data guide shows this and the imperative appendData / updateData calls.
Keep the array immutable. Each framework has one trap:
- React:
setData((prev) => [...prev, point]). An array changed in place keeps its reference, so the series does not see the change. - Vue: keep large datasets in a
shallowRefand assign a new array:data.value = [...data.value, point]. A deeprefwraps every point in a proxy.triggerRefafter an in-placepushdoes not reach the chart. - Svelte 5: keep chart data in
$state.raw(or a store) and assign a new array:data = [...data, point]. With a deep$state, the chart reads every point through a proxy, and a large dataset (100k+ points) blocks the main thread for seconds instead of milliseconds. On Svelte 4, assign a new array the same way.
For history that does not fit in memory, <EdgeLoader side="left" onTrigger={…}> calls your function when the view comes near the oldest loaded point, and draws a loading indicator at that edge until the promise resolves. Resolve with false when there is no more data. See Data loading. This component is in the React package only.
- Move the pointer over the chart. The crosshair follows it, the info bar at the top shows the values under it, and
<Tooltip>shows them next to the pointer. - Scroll to zoom the time axis. Drag to pan. On a touch screen, pinch to zoom and drag with one finger to pan.
- Double-click to fit all the data in view.
- Set
interactive={false}on the container for a chart that only shows data. chart.describe()returns what the chart shows as text: the ranges, each series, and likely mistakes such as a container with no height or a series outside the view. Use it in a test, or let an agent check its own chart.
To keep several charts in step, pass the visible range and the crosshair of one chart to the others from its viewportChange and crosshairMove events. See Multi-chart sync.
<Marker>pins one moment, such as a deploy or a peak. Give it aseriesIdand it sits on that series' line.<TimeRegion>shades an interval. Leave outtoand it runs to the right edge.<ReferenceLine>draws a level at avalue, or a vertical line at atime.
Annotations are not data: they stay out of the tooltip, the legend and the Y range. See Annotations.
Pick a built-in theme, build your own with createTheme(), or change one in the theme editor. A theme sets the colors, the font and the look of every part of the chart. Tooltips, legends and axis labels also take your own render code and keep their built-in position. See Custom renders.
Each series draws itself in when it mounts. Pick an intro animation per series, or write your own.

A shadcn/ui registry adds chart blocks to your project as source files you own. The blocks read the colors and the dark mode of your shadcn theme.
npx shadcn@latest add @wick-charts/chart-line-liveThe shadcn page shows every block live, with its install command and a usage example, for React, Vue and Svelte.
- Code: tree-shaken ESM, so you ship only the chart types you import. A candlestick chart alone is 55 kB gzipped.
- Dependencies: none besides your framework (React 18+, Vue 3.3+, Svelte 4 or 5).
- DOM: one
divwith a few<canvas>layers and a visually hidden text description per chart. - Network: no requests, no telemetry.
- Server rendering. The chart draws in the browser only. On the server, the container renders as an empty element.
- Screen readers. A chart gives a screen reader a short summary and a full text description, updated at most once a second. A reader cannot step through the points one by one: for a chart that matters, put a data table next to it.
accessibility={false}turns the text off;ariaLabelsets your own summary. - Before 1.0. A minor version can change the API. MIGRATION.md lists each change with the code to update.
npm install @wick-charts/react   # React
npm install @wick-charts/vue     # Vue
npm install @wick-charts/svelte  # Svelte
npm install @wick-charts/nuxt    # Nuxt module
@wick-charts/vue is ESM only: load it with import, not require().
@wick-charts/svelte is ESM only: load it with import, not require().
import {
  ChartContainer, CandlestickSeries, Tooltip,
  Crosshair, YAxis, TimeAxis, type OHLCInput
} from '@wick-charts/react';

export function Chart({ data }: { data: OHLCInput[] }) {
  return (
    <ChartContainer>
      <CandlestickSeries data={data} />
      <Tooltip />
      <Crosshair />
      <YAxis />
      <TimeAxis />
    </ChartContainer>
  );
}
Vue
<script setup lang="ts">
import {
  ChartContainer, CandlestickSeries, Tooltip,
  Crosshair, YAxis, TimeAxis, type OHLCInput
} from '@wick-charts/vue';

defineProps<{ data: OHLCInput[] }>();
</script>

<template>
  <ChartContainer>
    <CandlestickSeries :data="data" />
    <Tooltip />
    <Crosshair />
    <YAxis />
    <TimeAxis />
  </ChartContainer>
</template>
Svelte
<script lang="ts">
  import {
    ChartContainer, CandlestickSeries, Tooltip,
    Crosshair, YAxis, TimeAxis, type OHLCInput
  } from '@wick-charts/svelte';

  let { data }: { data: OHLCInput[] } = $props();
</script>

<ChartContainer>
  <CandlestickSeries {data} />
  <Tooltip />
  <Crosshair />
  <YAxis />
  <TimeAxis />
</ChartContainer>
This is Svelte 5 with runes. On Svelte 4, declare the prop with export let data: OHLCInput[]; instead.
ChartContainer fills its parent (width and height are 100%), so give the parent a height. The container also has a 240px min-height, so a parent with no height still shows a chart. For a smaller chart, such as a sparkline in a table row, set min-height: 0 (minHeight: 0 in React) in the container's style.
import { CandlestickSeriesDef, ChartInstance, type OHLCInput } from '@wick-charts/react';

const el = document.getElementById('chart');
if (!el) throw new Error('No #chart element');

const data: OHLCInput[] = [
  { time: Date.now() - 60_000, open: 100, high: 104, low: 98, close: 103 },
  { time: Date.now(), open: 103, high: 107, low: 101, close: 102 },
];

const chart = new ChartInstance(el);
const seriesId = chart.addSeries(CandlestickSeriesDef, {});
chart.setSeriesData(seriesId, data);
There is no @wick-charts/core package on npm: install the engine through one of the framework packages.
For a CodePen, a JSFiddle or a plain HTML page, load the prebuilt UMD bundle from a CDN. It puts the whole engine on a WickCharts global:
<div id="chart" style="width: 640px; height: 320px"></div>

<script src="https://cdn.jsdelivr.net/npm/@wick-charts/react/dist/wick-charts.umd.min.js"></script>
<script>
  const { ChartInstance, LineSeriesDef } = WickCharts;

  const chart = new ChartInstance(document.getElementById('chart'));
  const id = chart.addSeries(LineSeriesDef);
  chart.setLayerColors(id, ['#22c55e']);
  chart.setSeriesData(id, [
    { time: Date.now() - 2 * 86_400_000, value: 100 },
    { time: Date.now() - 86_400_000, value: 118 },
    { time: Date.now(), value: 109 },
  ]);
</script>
The same file is on unpkg (https://unpkg.com/@wick-charts/react/dist/wick-charts.umd.min.js); pin a version with @x.y.z for production. The file is self-contained.
Every component, prop, type and slot context is in the docs site. Start at ChartContainer, then pick a series or an overlay in the sidebar.
Bug reports, feature requests and pull requests are welcome. Open an issue first for anything larger than a small fix, so we can agree on the approach.
pnpm install
pnpm dev         # docs site with every chart type at http://localhost:5173
pnpm test        # unit and integration tests
pnpm lint        # Biome
pnpm typecheck
A pull request should pass pnpm test, pnpm lint and pnpm typecheck, and add a test for each bug fix.
MIT — always free and open.